UI/UX Designer
May 2025 - Aug 2025
1 Project Manager, 1 Operation Research Scientist, 1 Design Strategist
Information Architecture, Interaction Design, Data Visualization
This project focused on making complex operational data spanning aircraft, crew, maintenance, ground operations, and passengers easier to reason about in real time, especially during disruptions.
As a UI/UX Design Summer Assciate at Optym, I worked on redesigning internal airline network dashboards used by Southwest Airlines. The objective was to simplify complex operational data, such as flight networks, crew scheduling, and performance KPIs, into intuitive visual dashboards that improved situational awareness and decision-making across multiple teams.

The How?
Reality of the Airline Network
When your flight is delayed or canceled, you receive a notification saying you’ll be rebooked shortly. There’s a brief window before the system assigns you a new flight. During that time, you can choose to wait, rebook yourself, or abandon the airline entirely.
That short moment of choice feels personal, but it’s actually the result of dozens of operational decisions unfolding behind the scenes.
A crew may be approaching duty limits. A gate could already be over capacity at the next station. A single delay, cancelcan quietly ripple across the entire network.
This is the reality airline teams operate in every day: many small decisions, tightly coupled, with very little time to act.
"How might we help teams understand the airline as one connected system so they can make proactive decisions before disruptions cascade?"
There are already powerful optimization and reporting tools. The issue wasn’t a lack of intelligence, it was a lack of shared understanding.
Leadership struggled to intervene before delays cascaded. At the same time, operators were making time-critical decisions around gates, crew legality, maintenance constraints, and passenger recovery, often with only partial context.
Because each team viewed the system through fragmented tools, decisions that were deeply connected were made in isolation. As disruptions grew, teams were forced to mentally simulate downstream impact under pressure. The systems worked in isolation, but together they failed to support how humans actually reason when time and consequences are tight.
Understanding the system
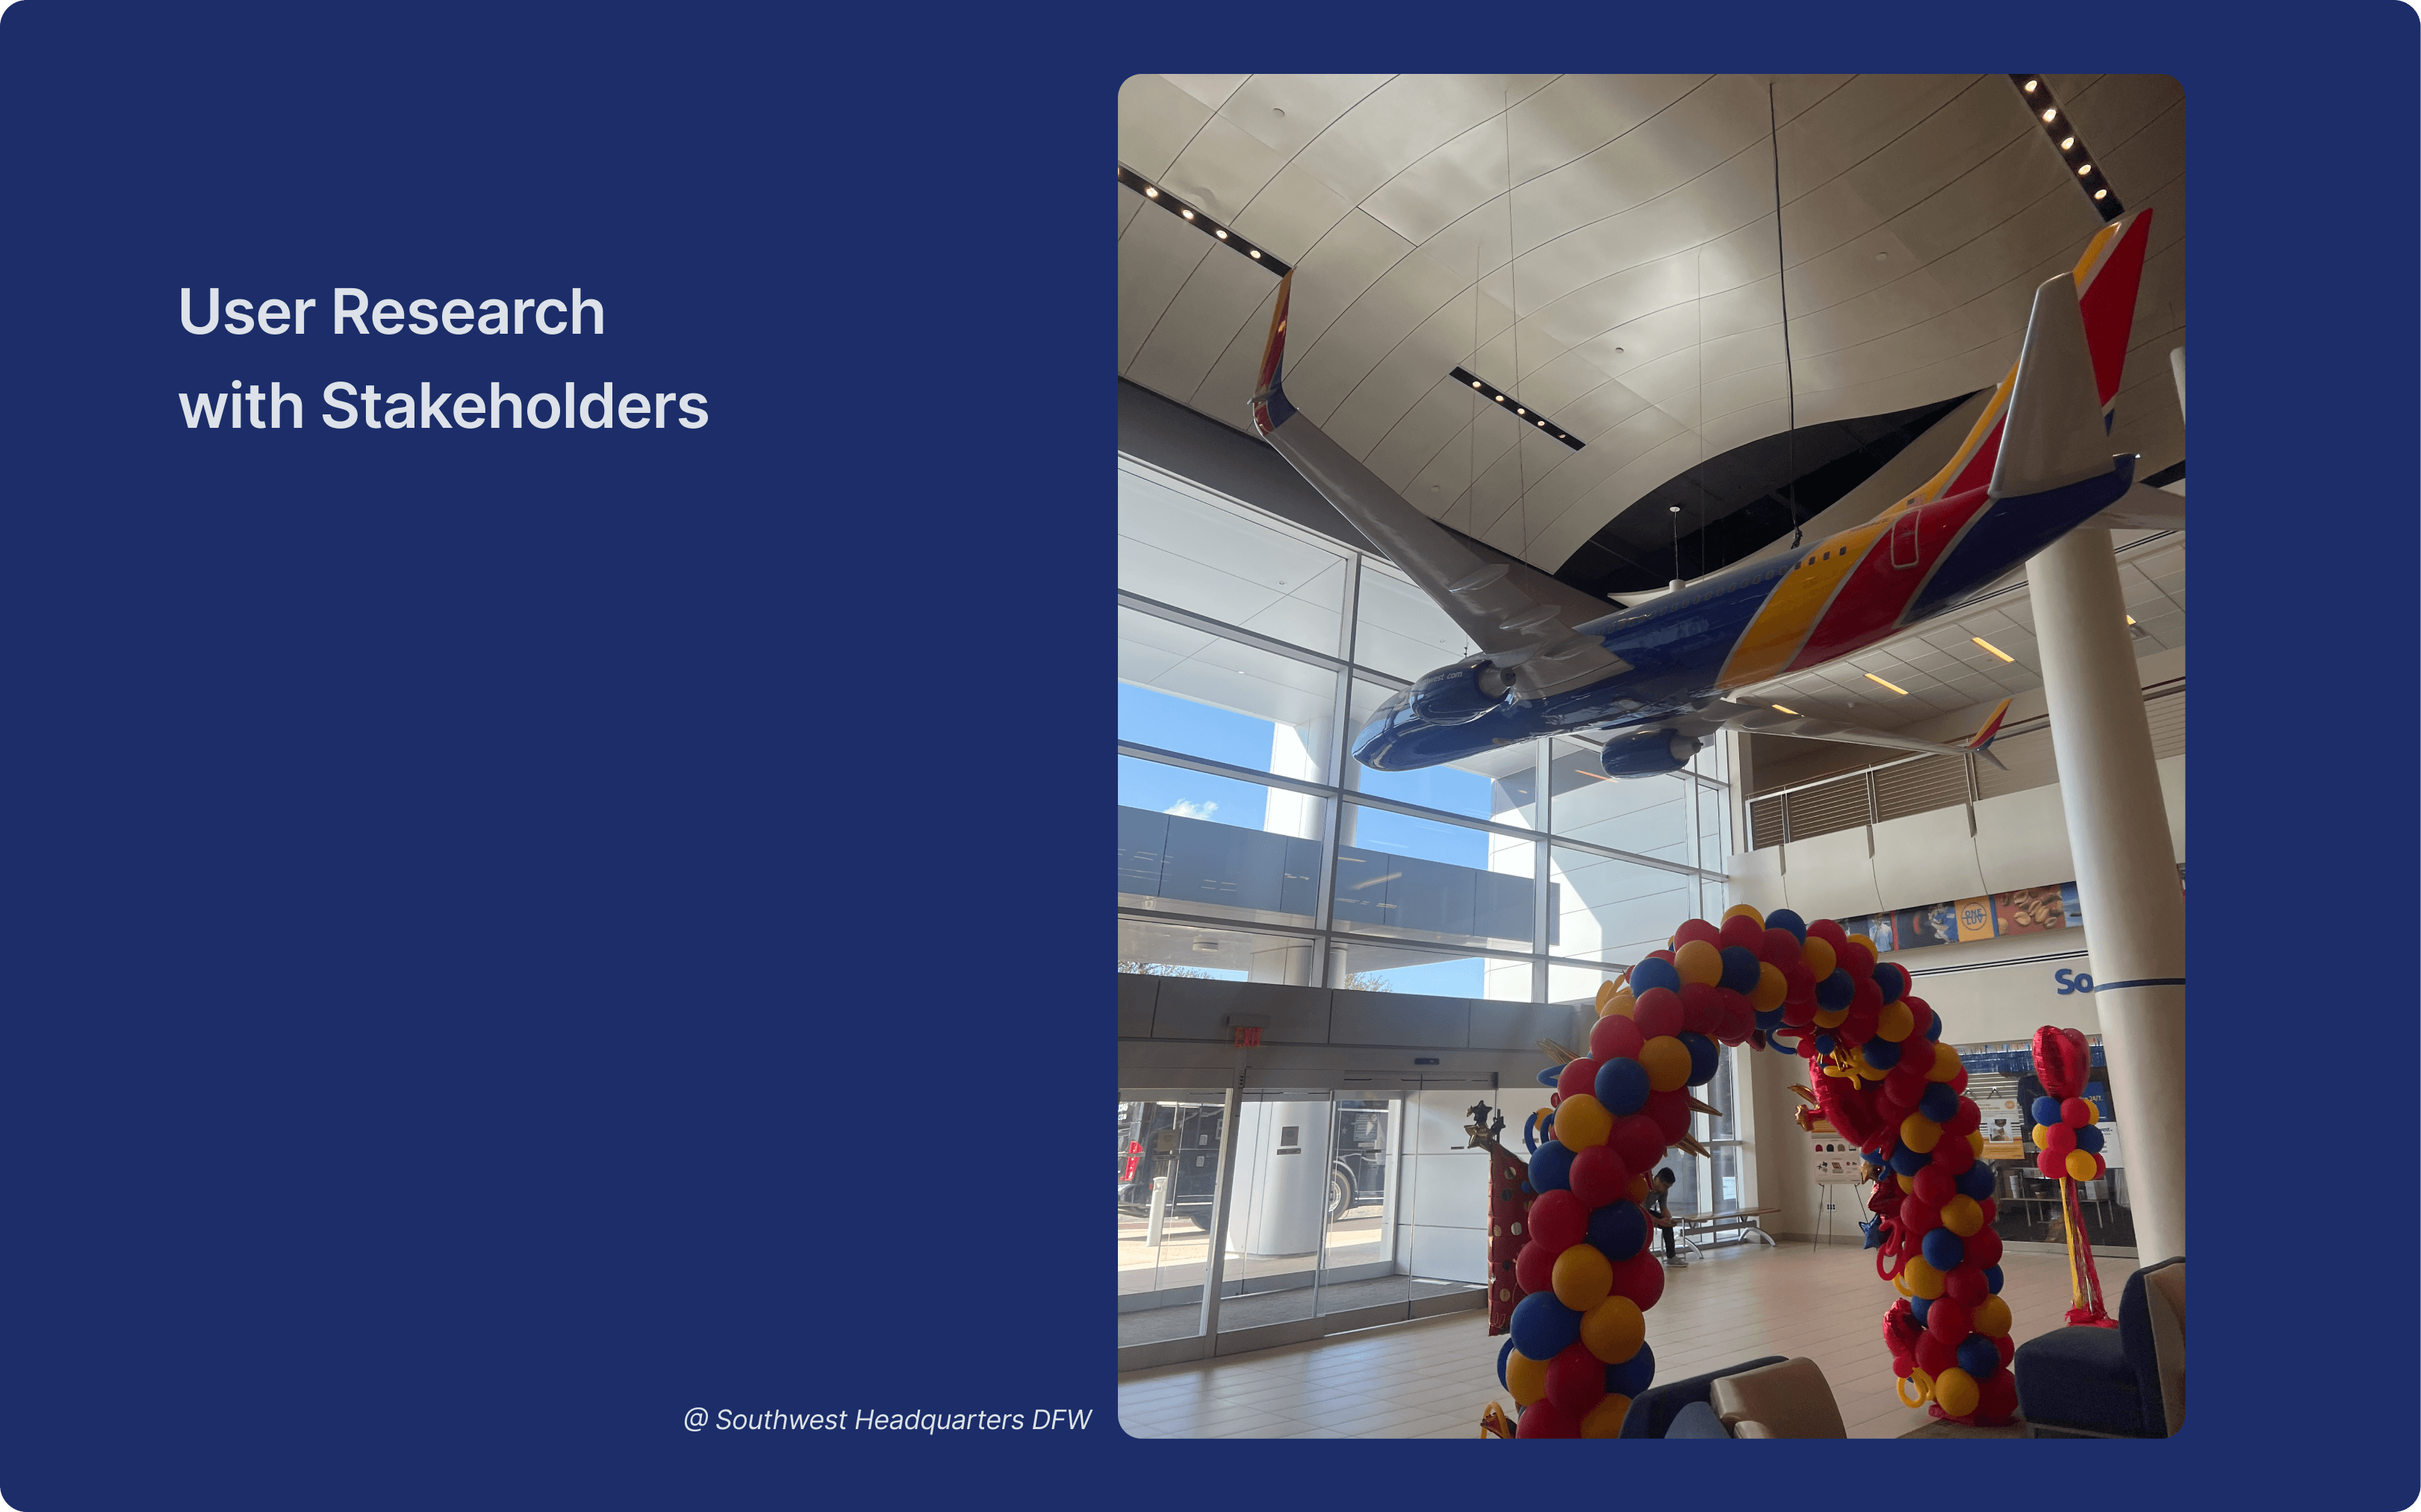
Through several interviews and field research with network directors, system operations directors, dispatchers, crew planners, maintenance control, ground operations, and customer operations. I also spent time on-site observing how these teams coordinated during disruptions.
Across roles, people asked for the same things: a real-time view of network health, clarity on what was at risk, and visibility into downstream impact before committing to a decision.
Situational awareness across a coupled system
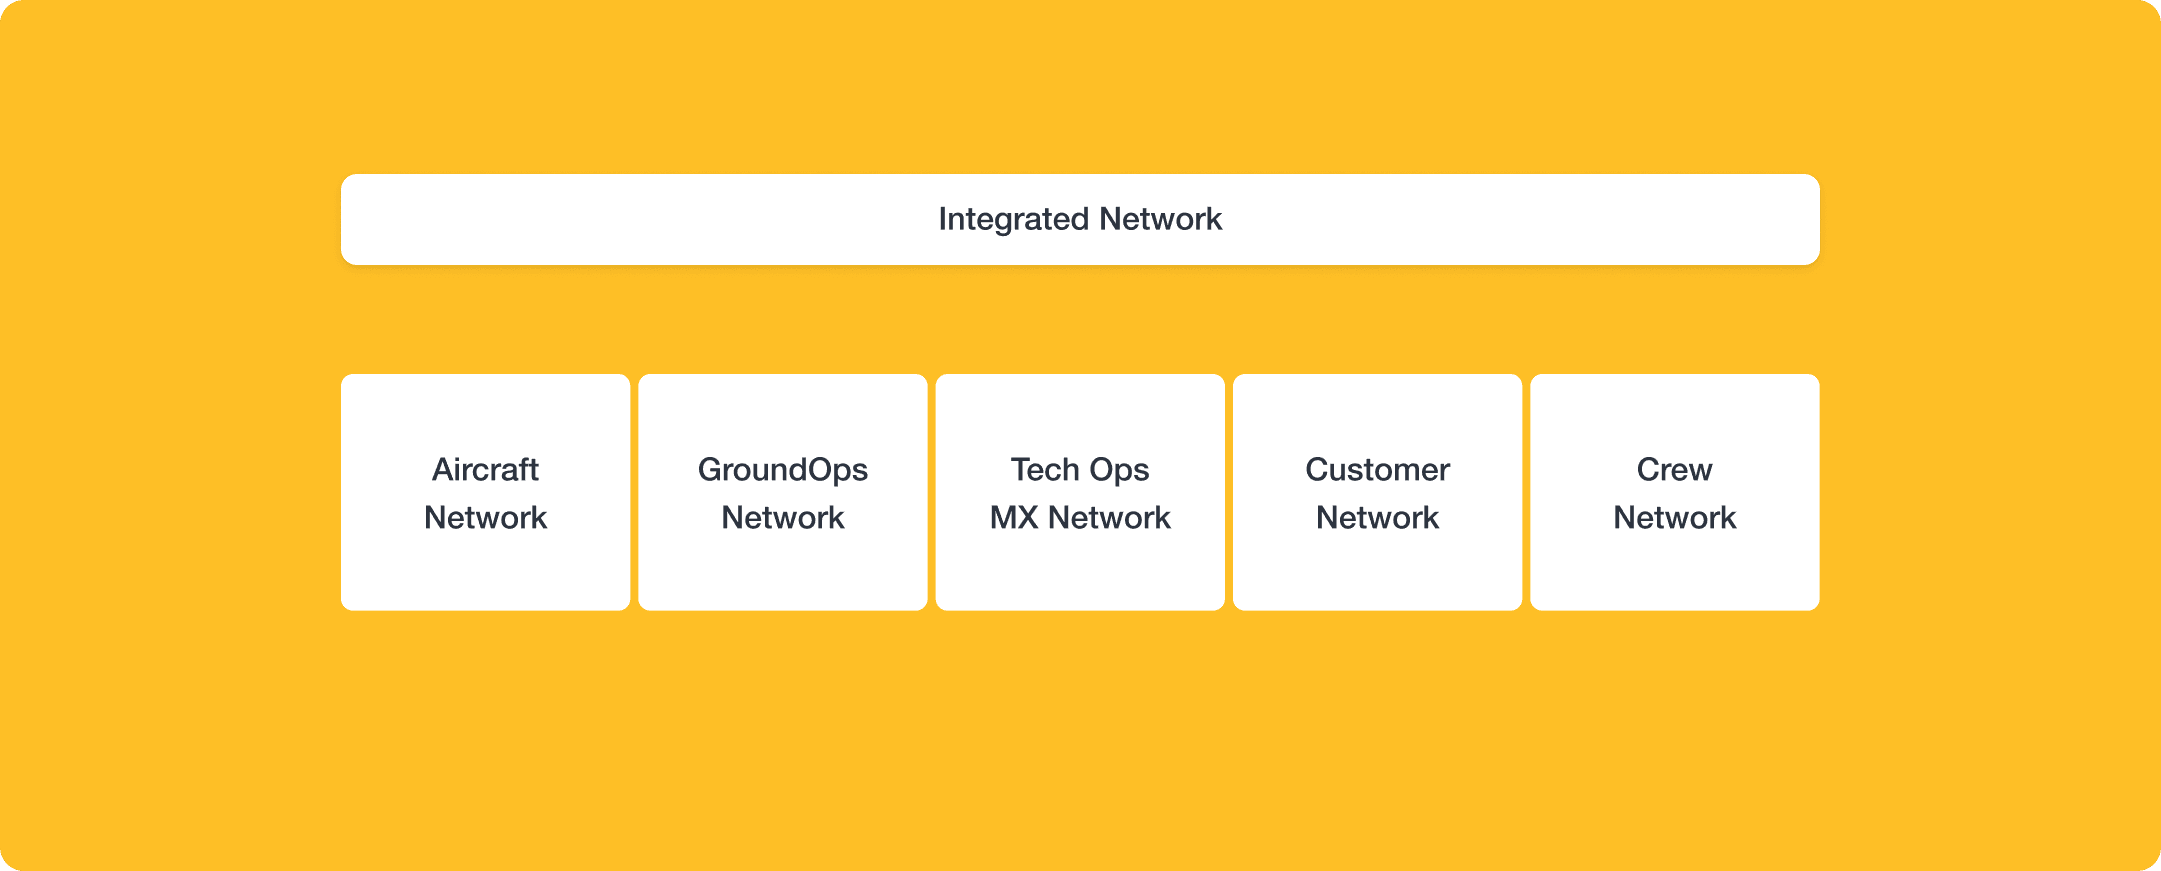
I mapped the airline as a living network rather than a collection of dashboards.
Each part of the system carried hard constraints. Crew operated within duty and rest limits. Aircraft followed maintenance cycles and assignment rules. Ground operations balanced gate availability and staffing. Customer teams worked within narrow rebooking windows that often determined whether passengers stayed or left.
What became clear was that decisions in one network immediately affected the others, yet those relationships were rarely visible in the tools teams relied on.
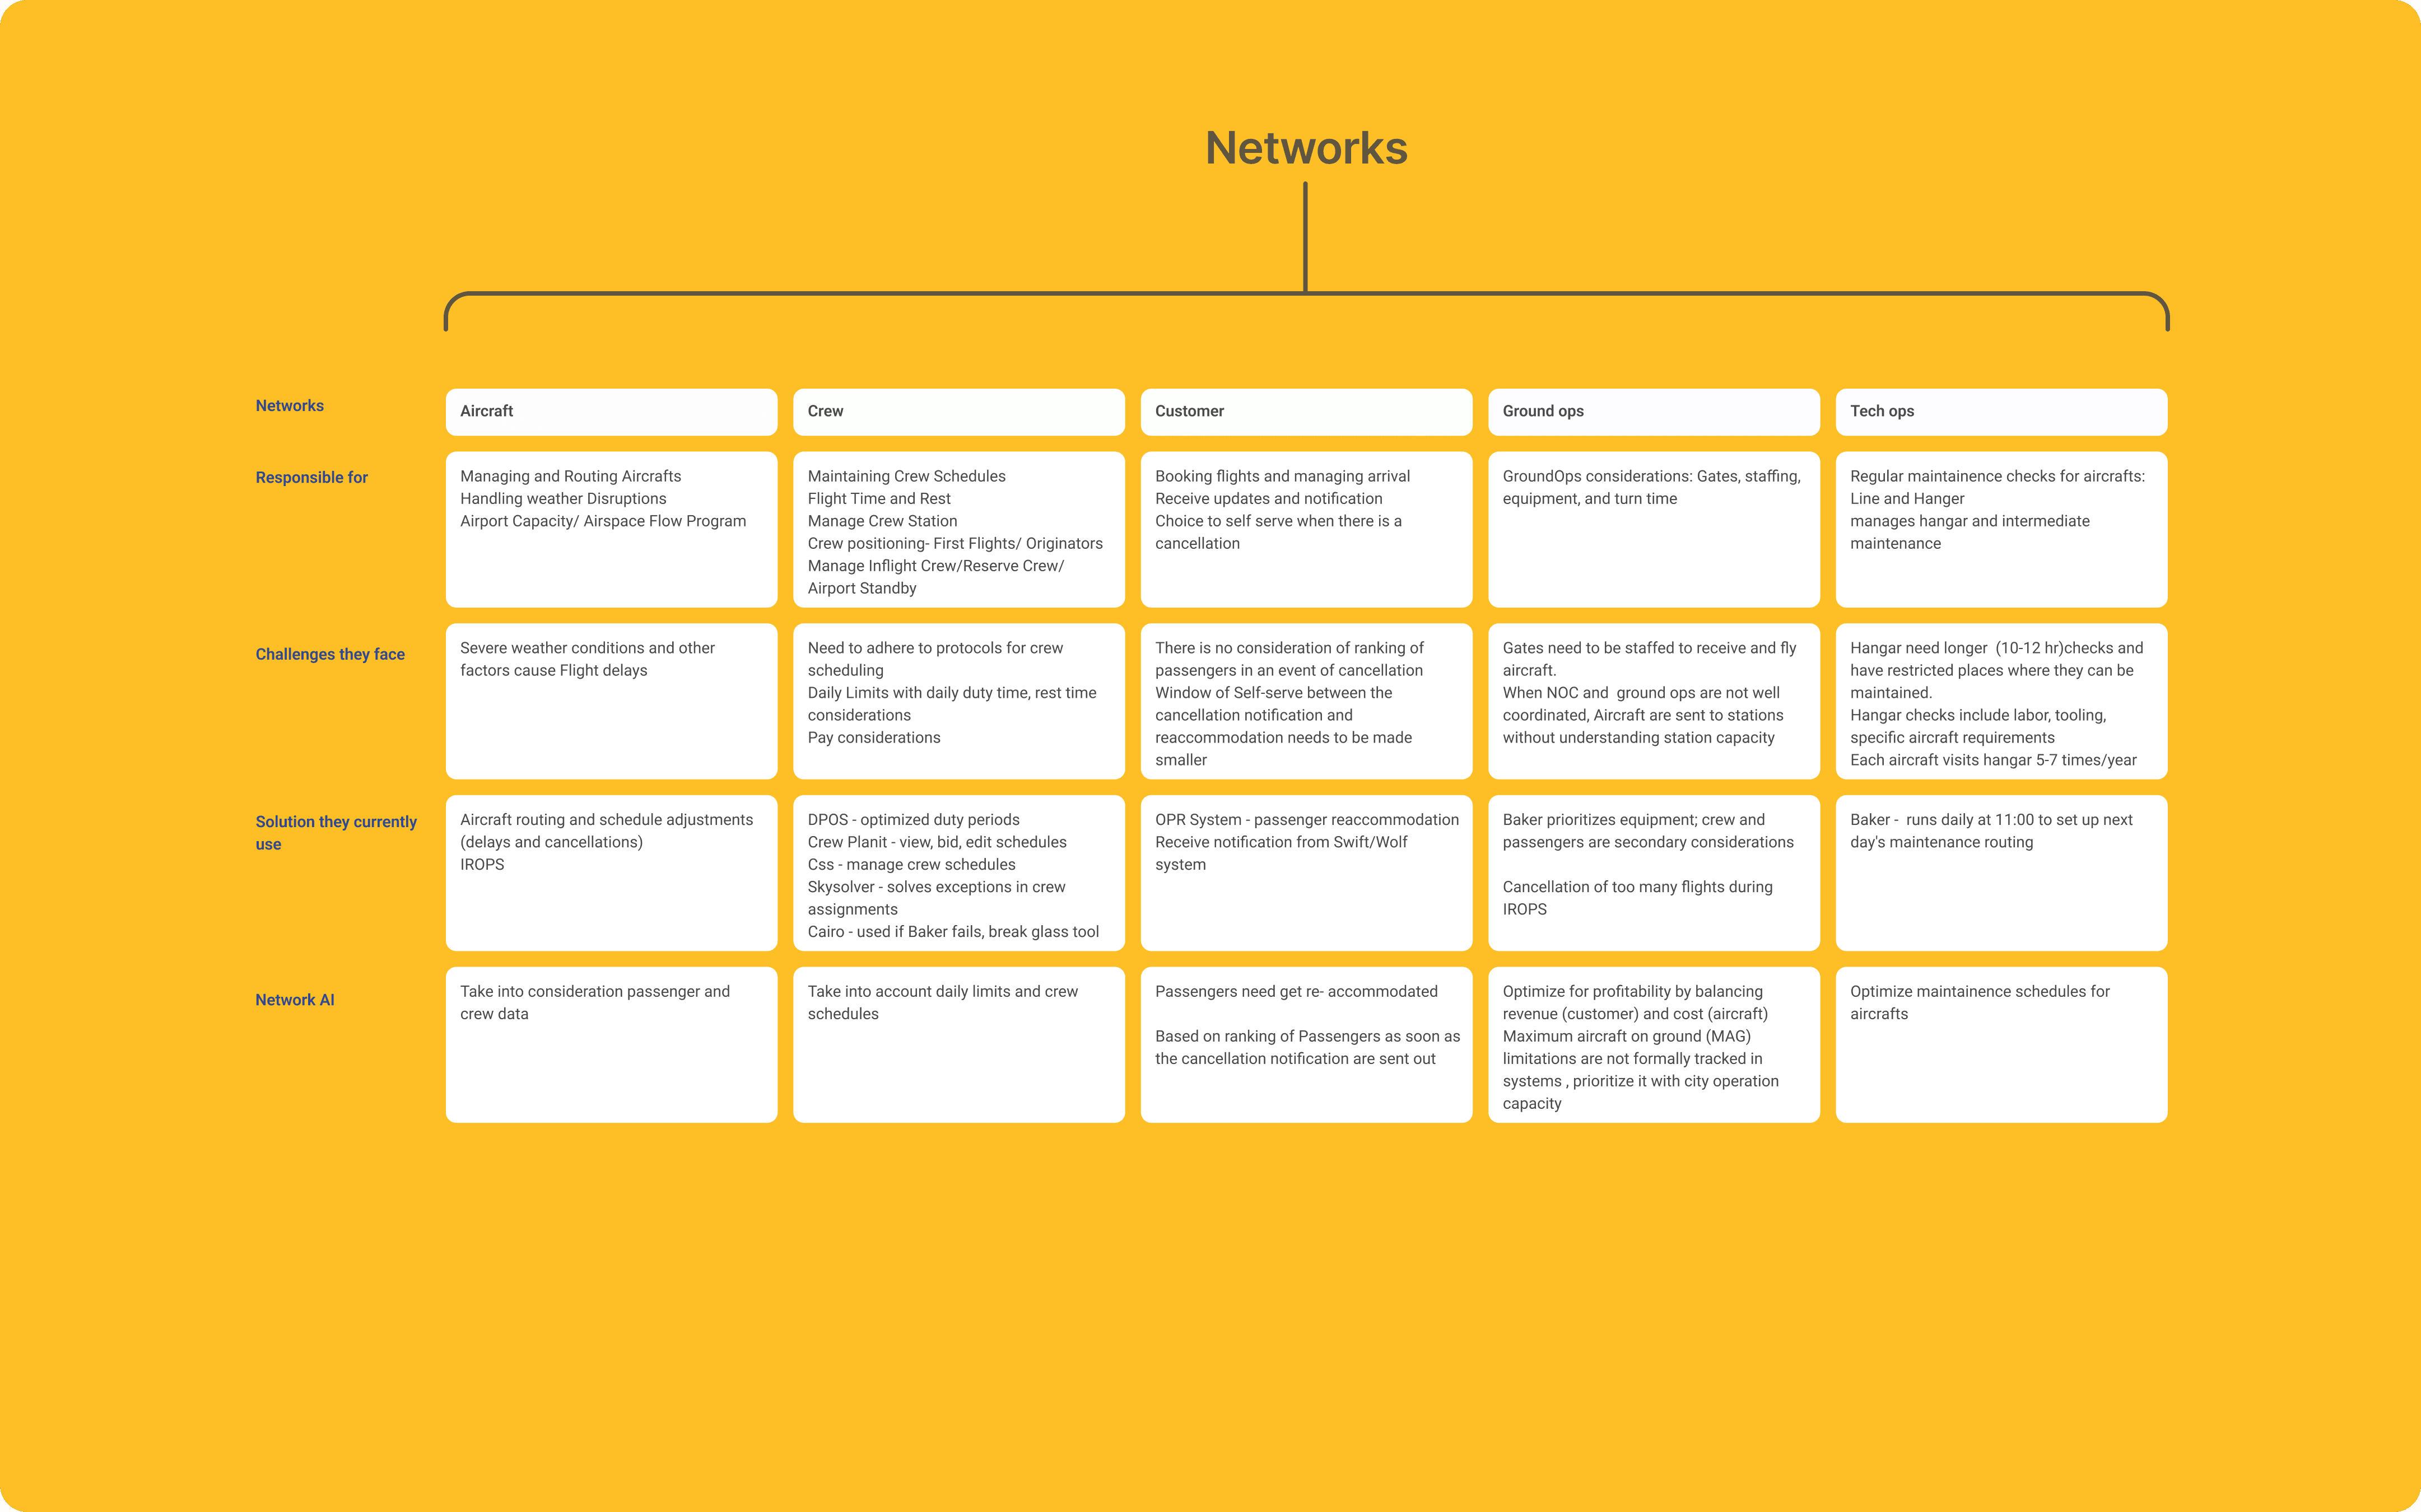
Mapping complexity
I was working across multiple user groups, each with very different responsibilities, constraints, and definitions of success. Planning the research meant coordinating time with teams whose days were already shaped by disruptions, shift changes, and real-time decision-making. Instead of running one-size-fits-all interviews, I tailored each session to the kinds of decisions that role actually made and the moments where uncertainty caused the most friction.
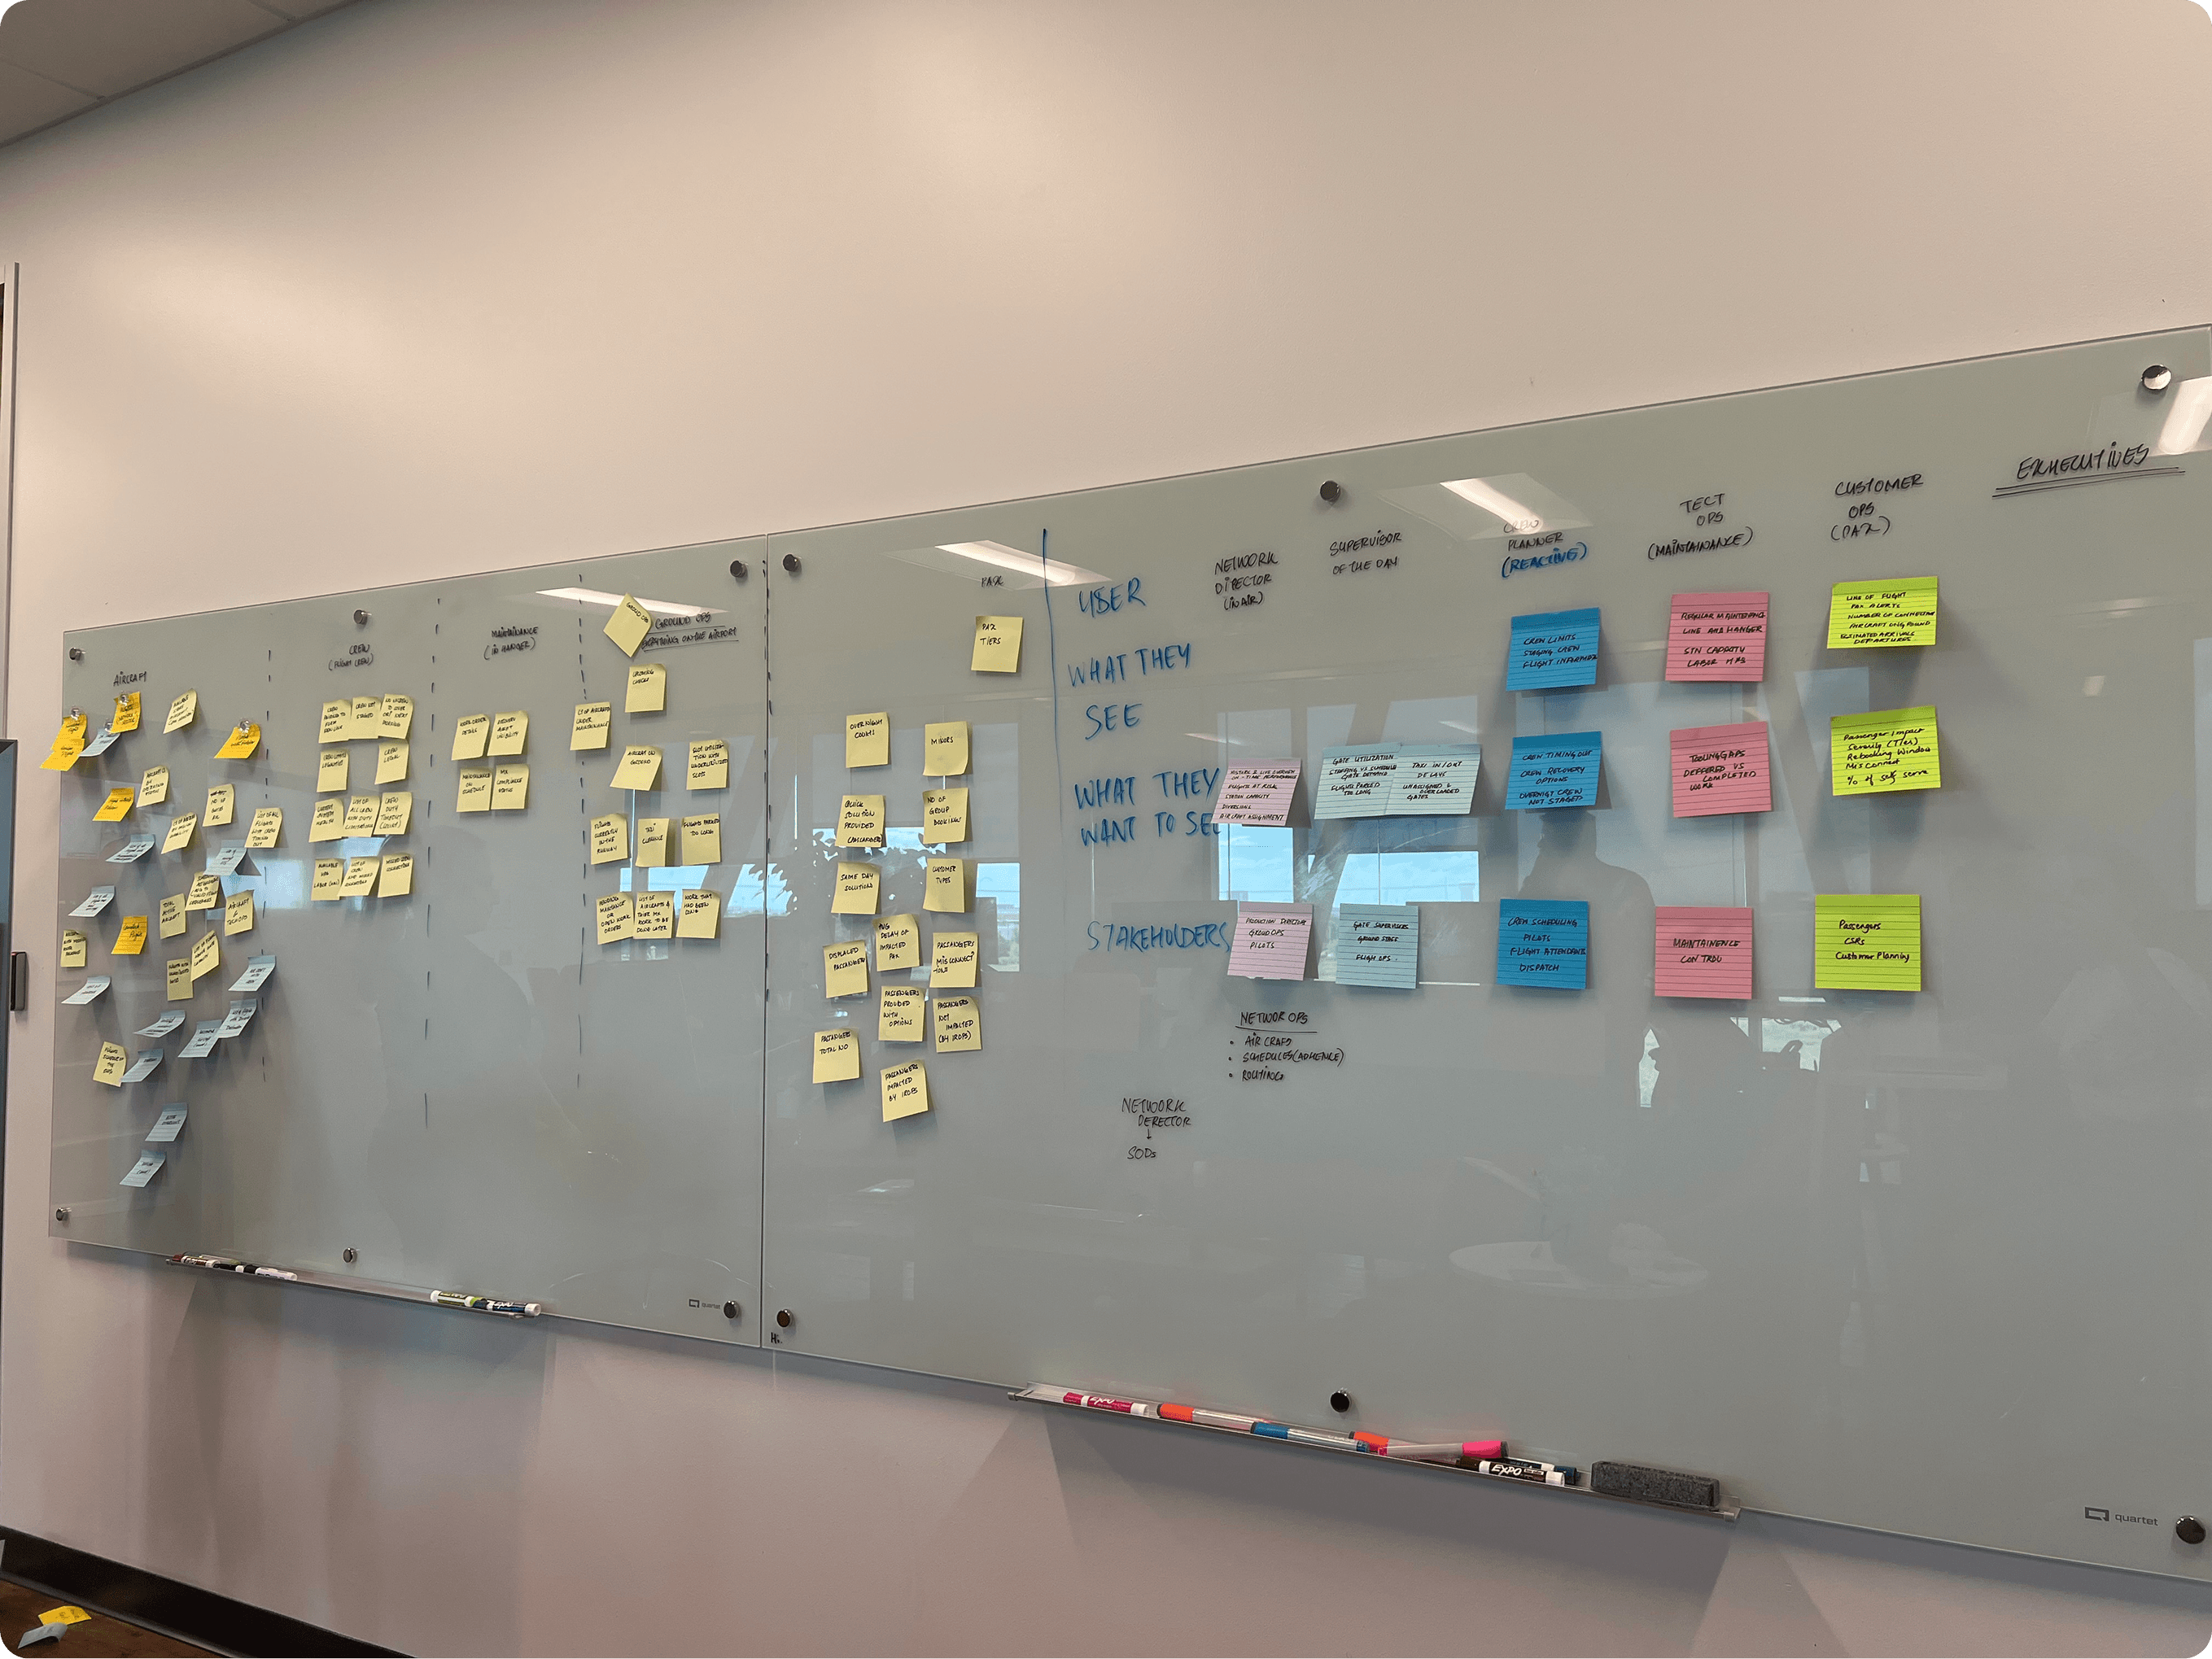
As insights came in, I brought them back into synthesis sessions with the design team. We whiteboarded flows, clustered observations through affinity mapping, and explicitly surfaced risks, tradeoffs, and potential wins. These sessions helped us move from isolated anecdotes to patterns that held across roles where breakdowns consistently occurred and where small design interventions could have outsized impact.
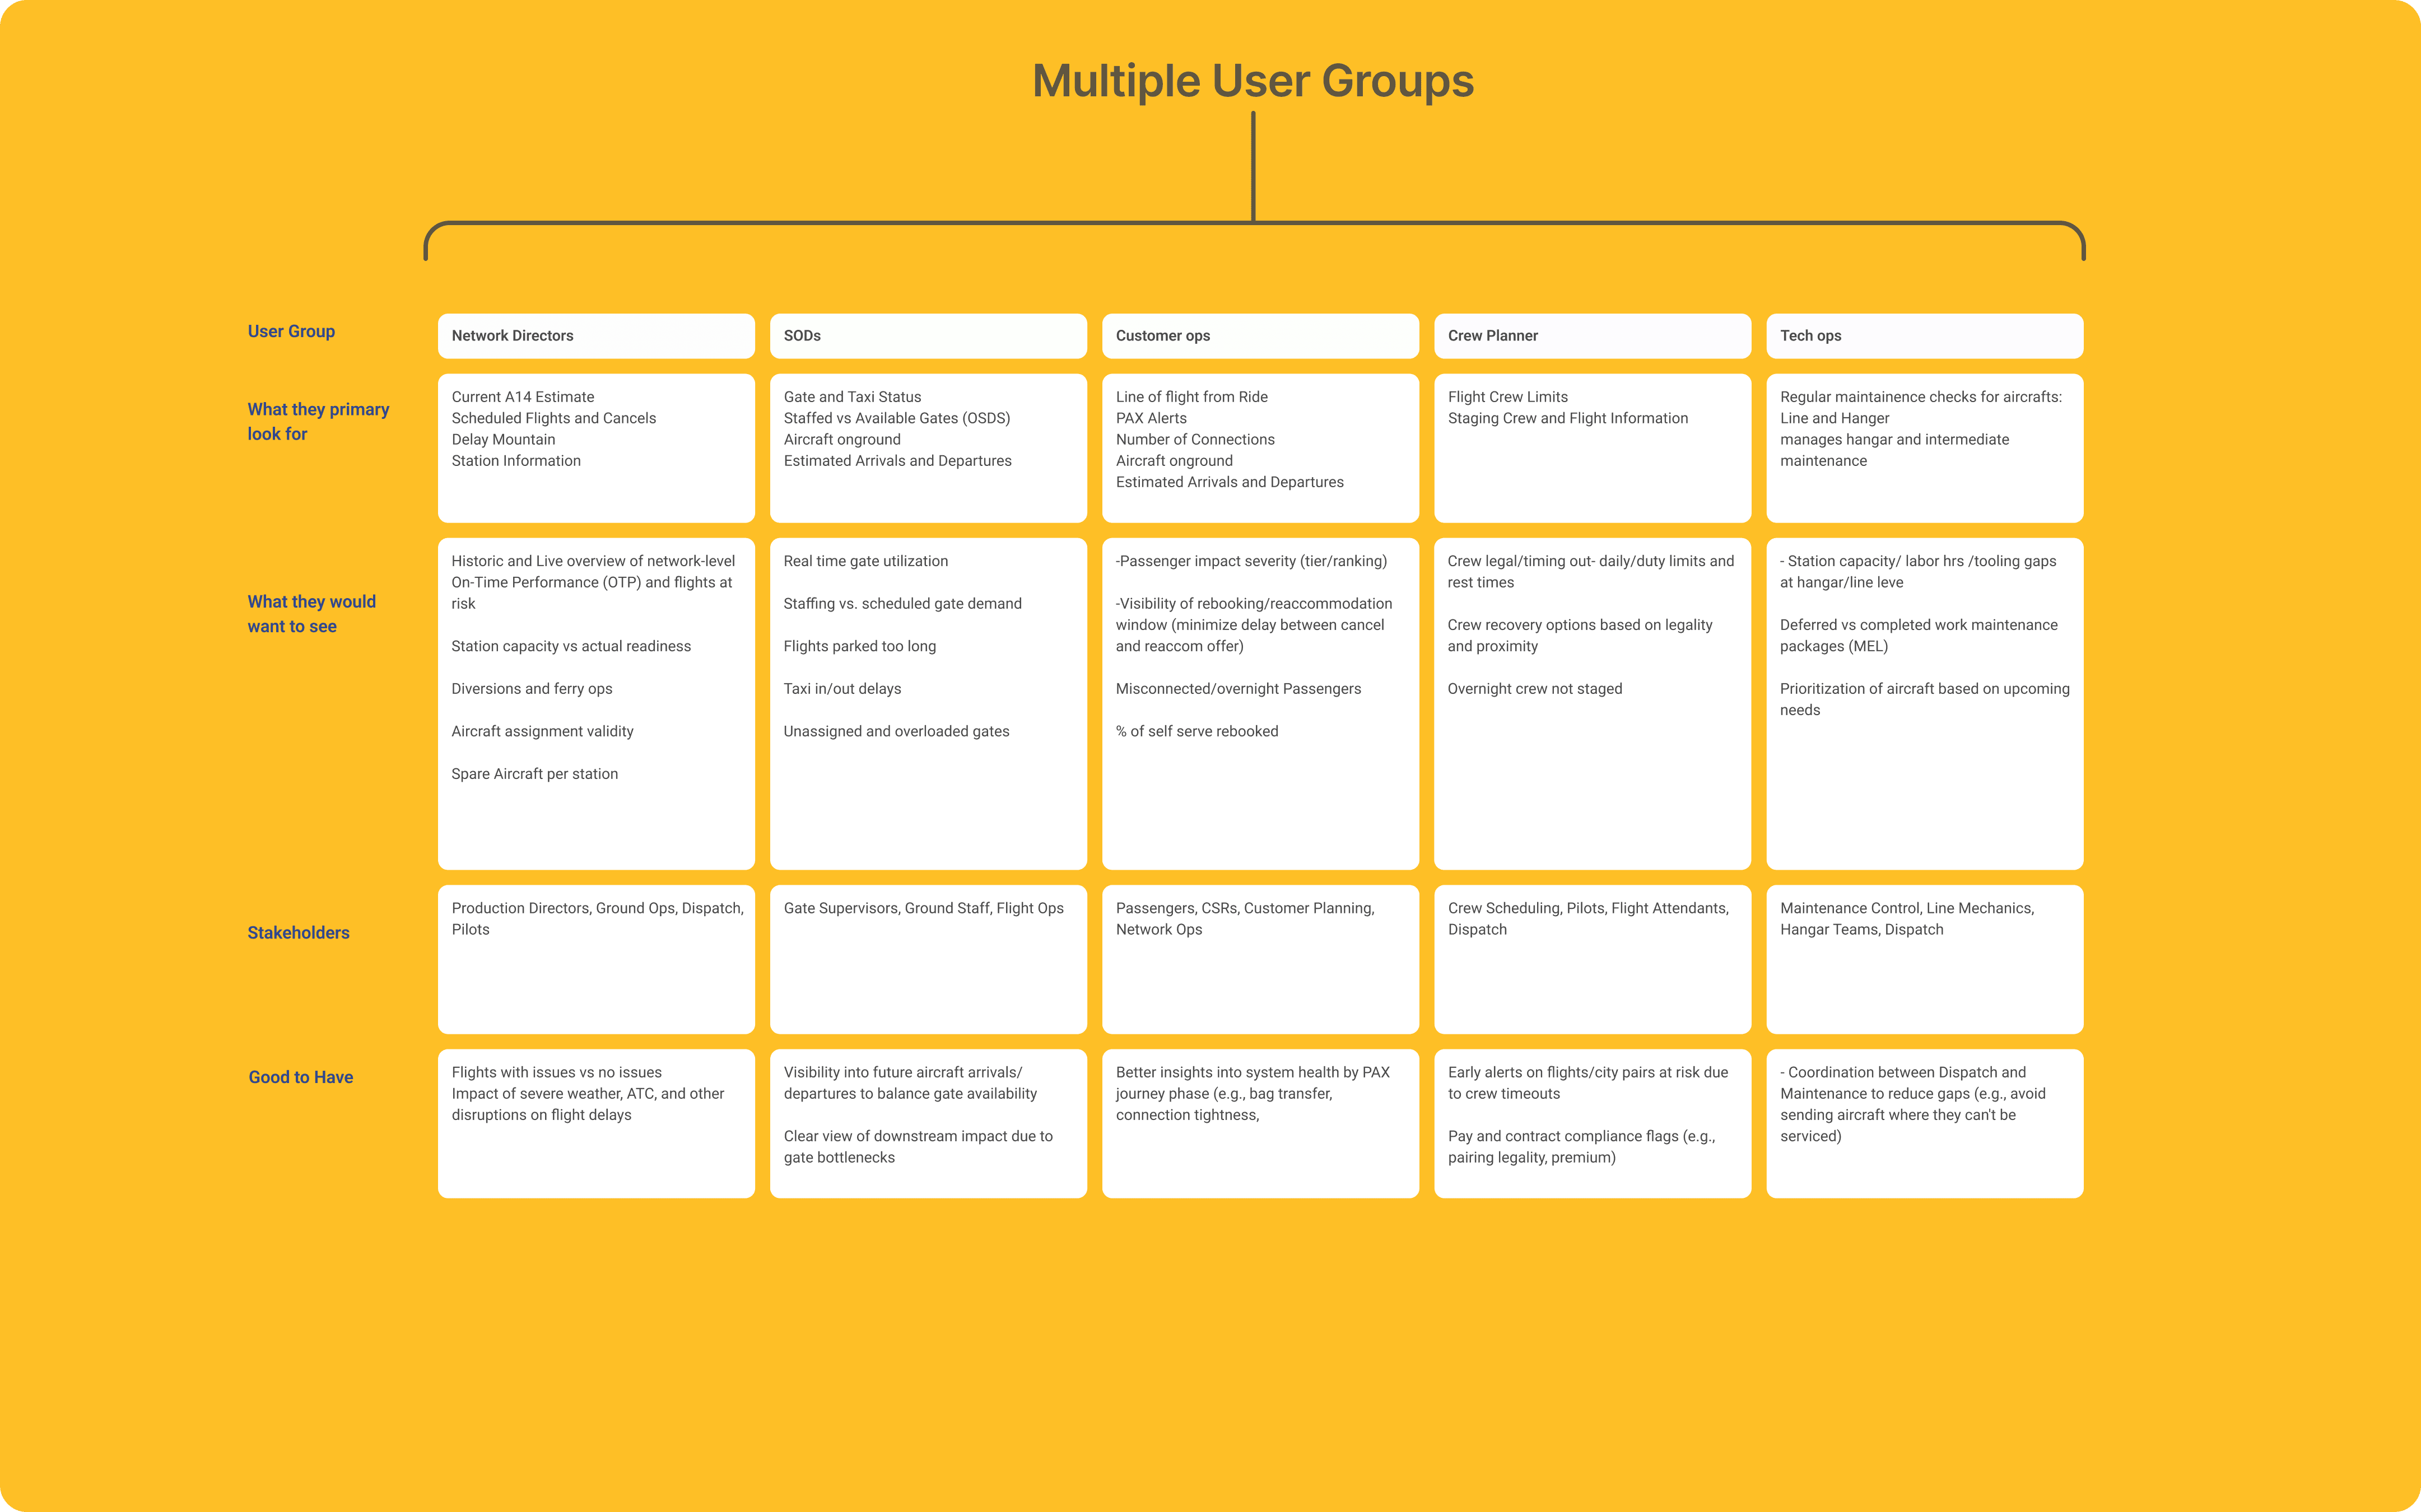
From there, I mapped the needs of multiple stakeholders side by side. This wasn’t just about capturing user requirements, but reconciling them with operational constraints and business realities. The information architecture grew directly out of these conversations, shaped as much by system dependencies and edge cases as by usability. Many of the requirements conflicted at first, and part of the design work was making those tensions visible so the team could make informed decisions rather than default compromises.

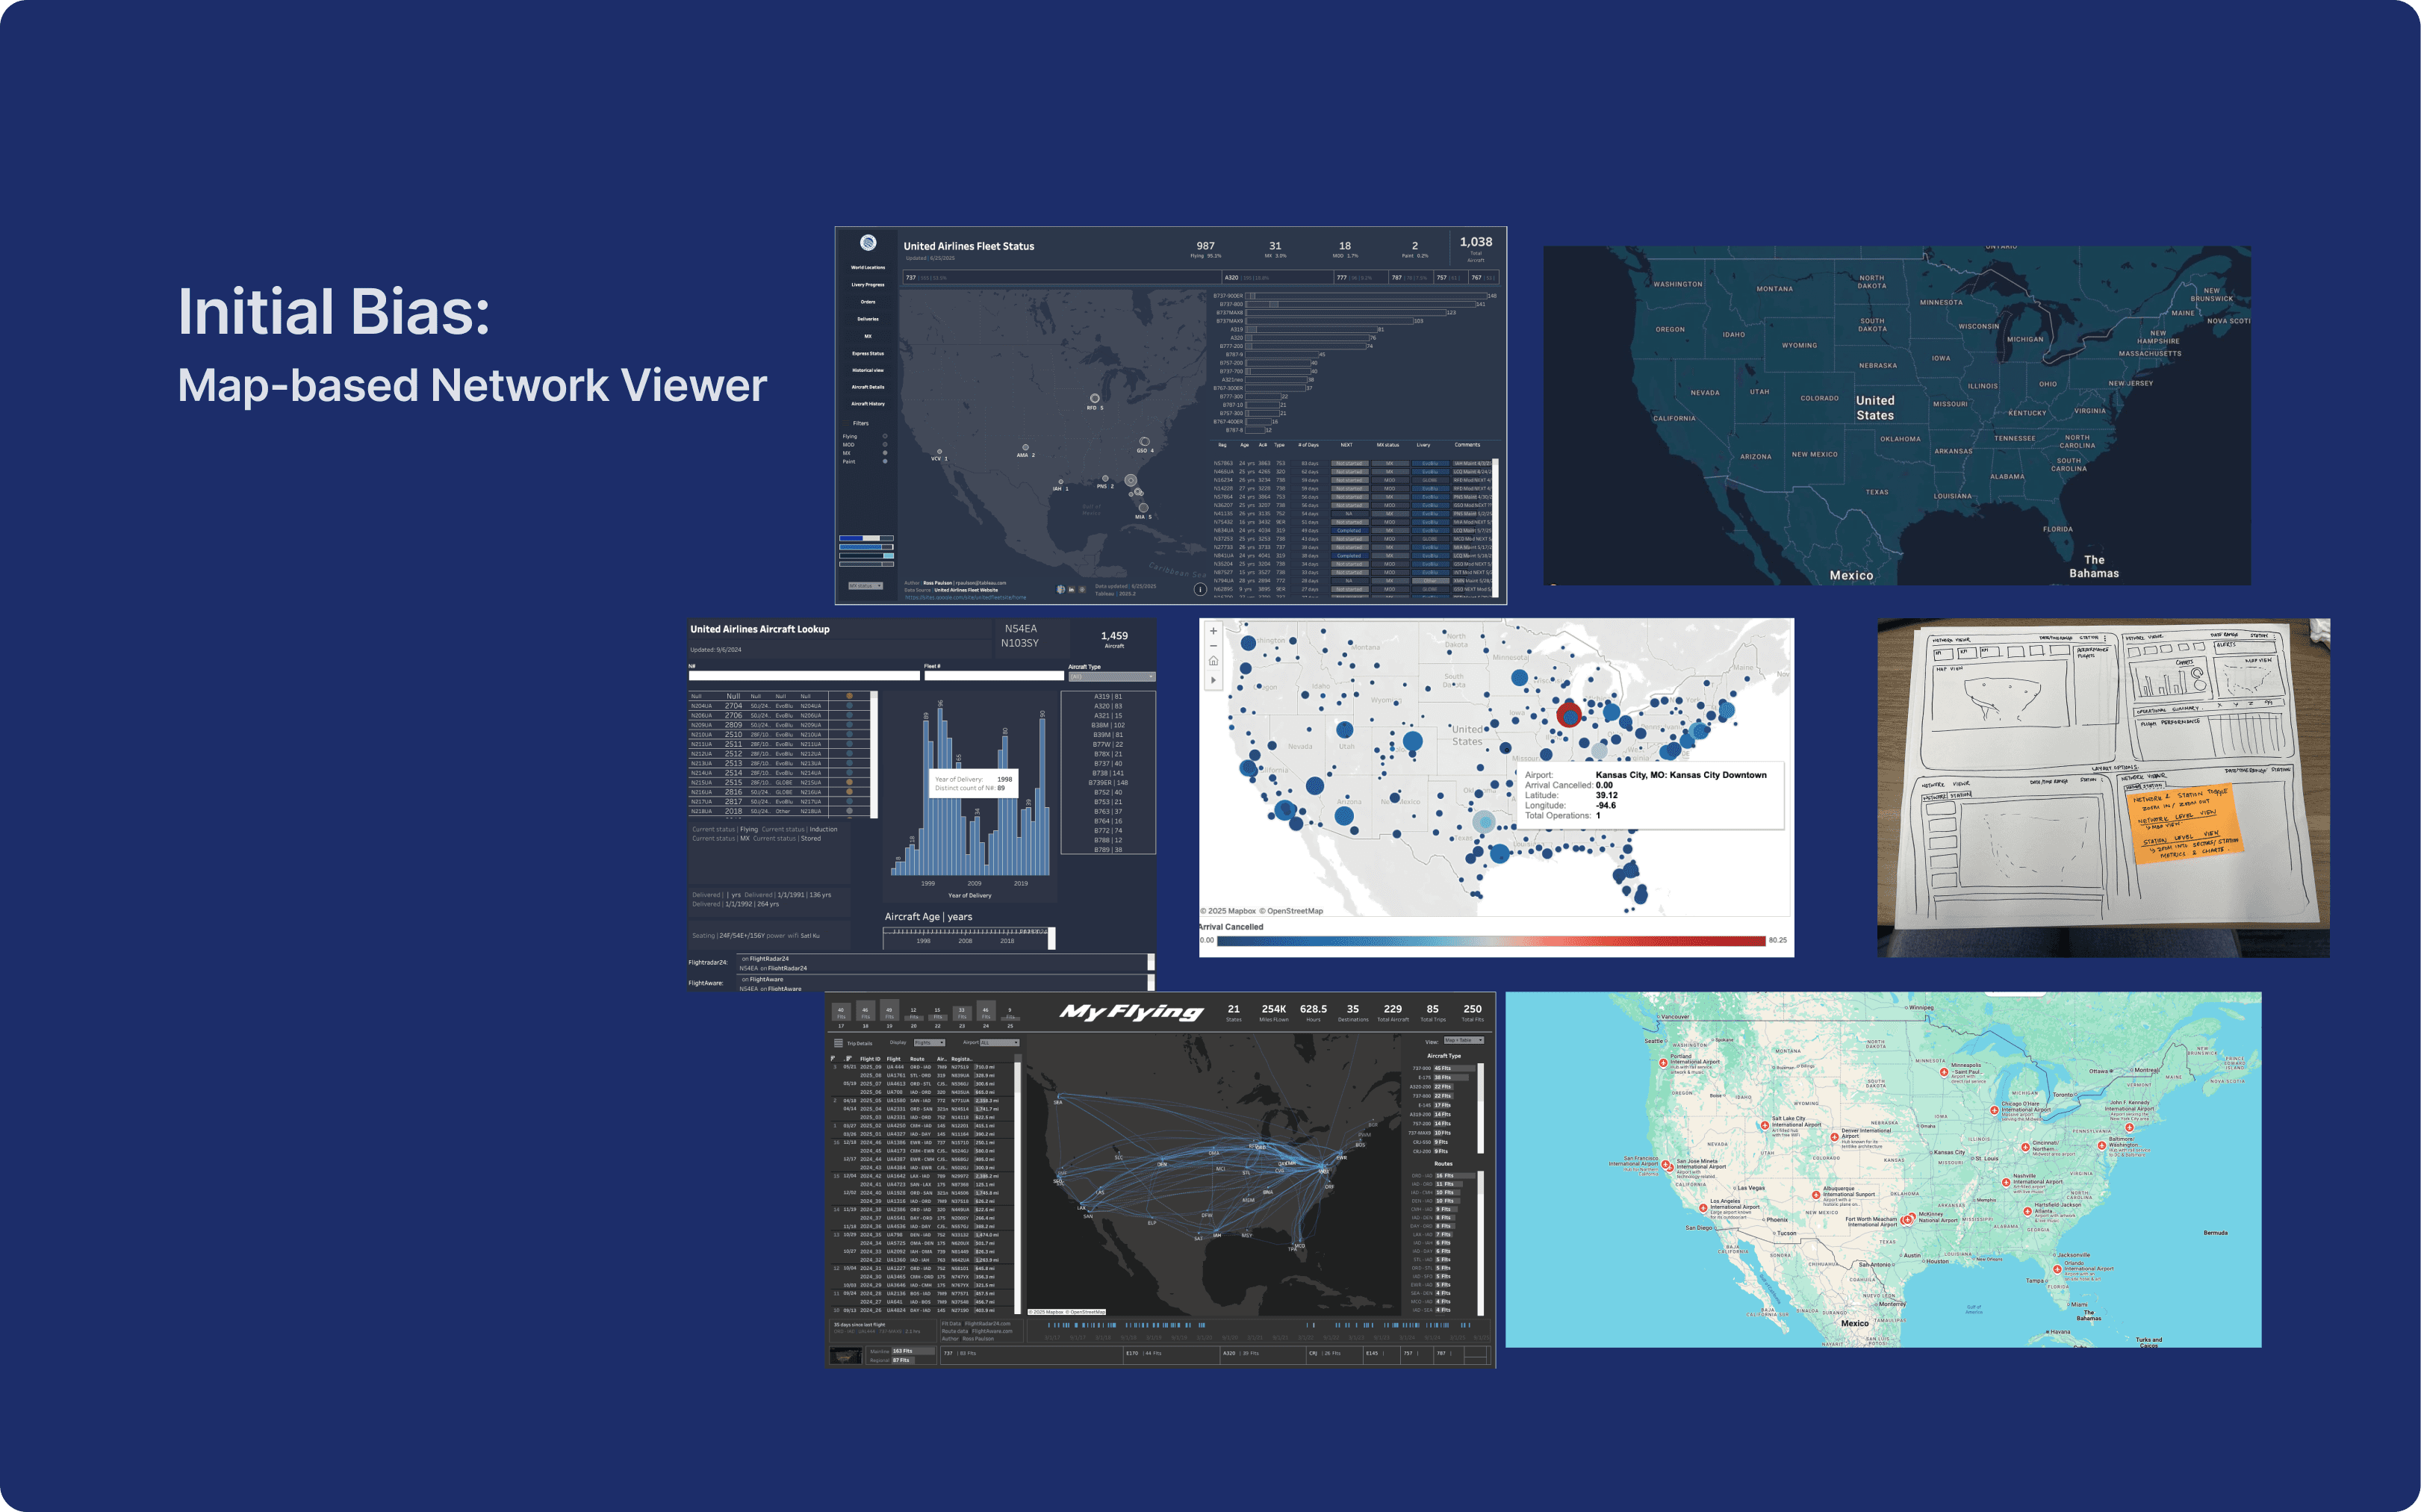
Early on, there was a strong bias toward map-based solutions, since spatial views felt familiar and reassuring to users. We intentionally questioned that bias testing when maps clarified decisions and when they added noise. This helped the team avoid designing for familiarity alone and instead focus on what actually supported reasoning under pressure
The What?
Project Outcome
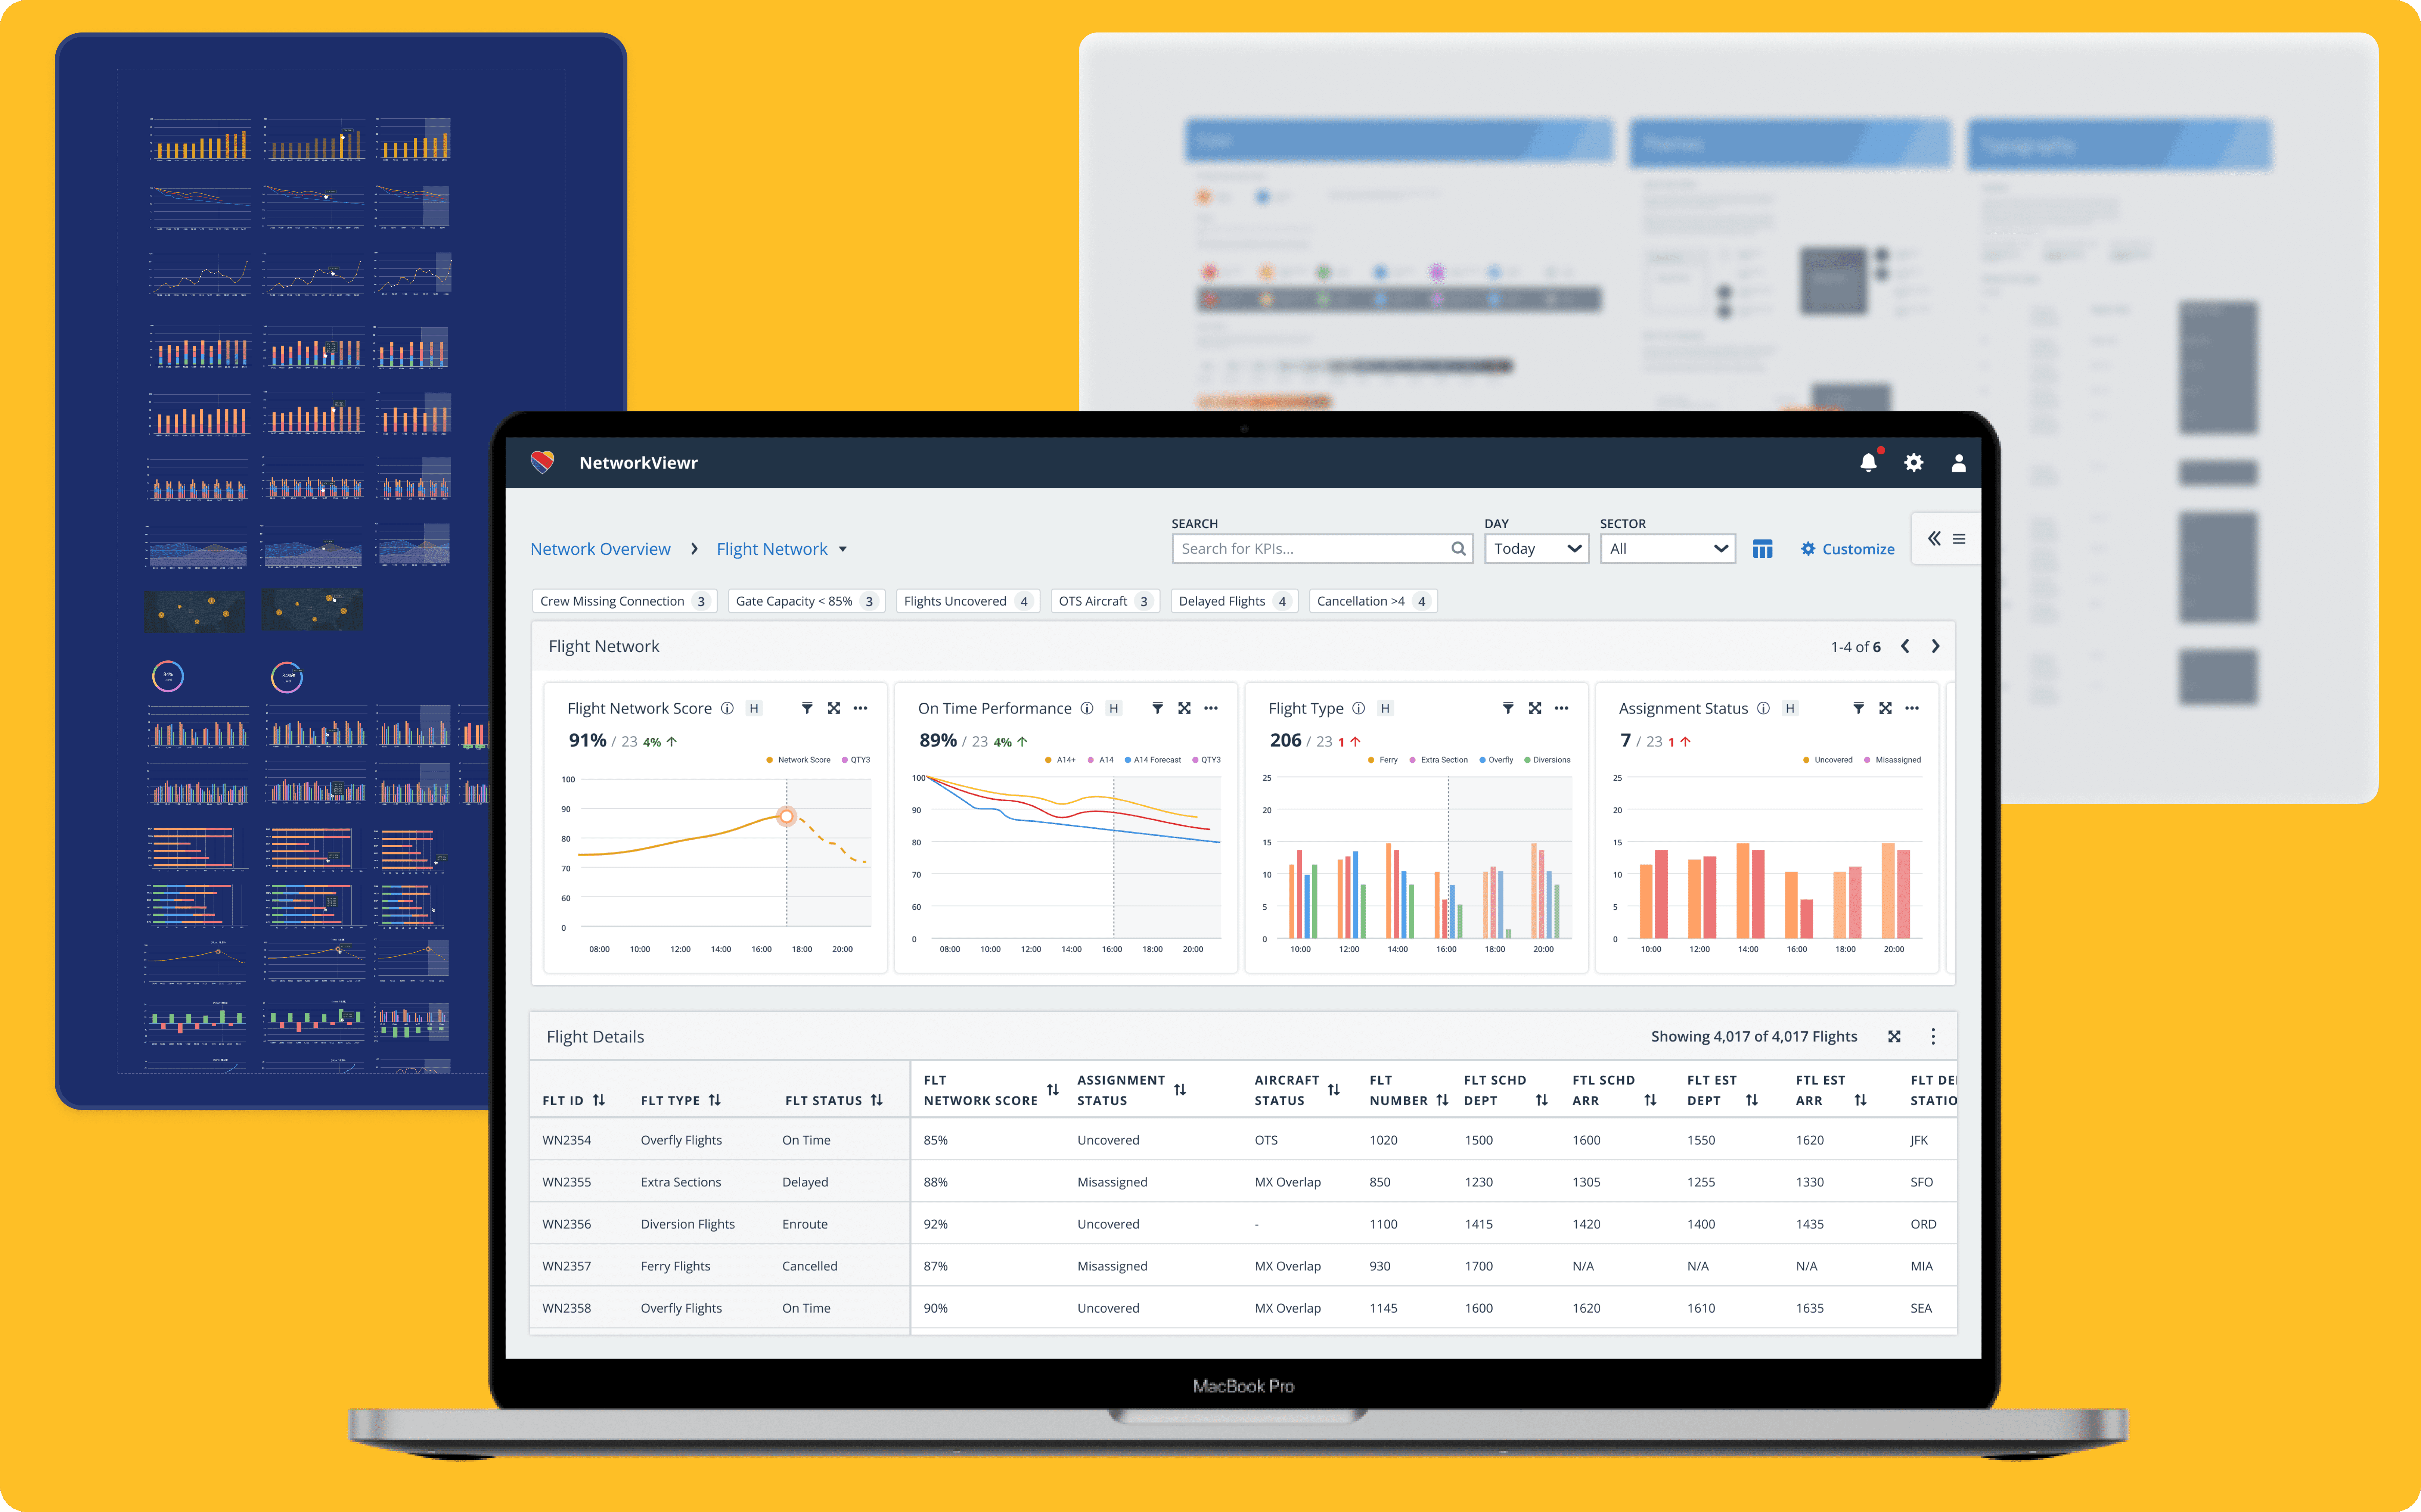
The final direction aligned leadership and frontline teams around a shared view of network health, while still supporting the depth required for role-specific decisions. Rather than adding another dashboard, the work reframed how operational data was structured, interpreted, and acted upon.
Takeaway
This project reinforced the importance of designing with complexity instead of hiding it. Working closely with multiple teams showed me how essential it is to plan research thoughtfully, synthesize collaboratively, and challenge familiar patterns when they no longer serve users. Most importantly, it demonstrated how design can act as a bridge between powerful systems and the humans who depend on them in high-stakes moments.
Project Status
This project was completed under NDA. While I’ve shared the design approach and outcomes here, I’m happy to walk through additional details, artifacts, and decision-making during a conversation.